Today you can follow me on an expedition. After having rolled out the treasure map in my last post we will now take up the quest. Our target is nothing less than the Holy Grail of Limited Magic:
Today we search for the optimal mana curve of a limited deck.
Just recently I presented a rather convoluted way to assess the strength of any given mana curve. We thus derived a mapping from a deck’s mana curve onto the deck’s power. Using this method, we are able to evaluate and rank various mana curves by strength.
Figure 1: Copyright owned by Wizards of the Coast
Within today’s post we want to solve the obvious implicit problem of finding the mana curve that maximizes the strength of a deck. By doing so, you will be rewarded with an optimal mana curve which provides a useful orientation guide for your drafts to come.
The Search for the Optimal Curve
The evaluation procedure presented in the previous post was based on two steps. First, a mana curve was first translated into a mean executed curve, which represents the average amount of mana a deck is capable to spent over the single turns. Afterwards this executed curve is evaluated using an index measure, that weighs the relative impact of each turn in order to derive one single score for the original curve. As a reasonable index measure we derived a so-called Discount-Index, in which the impact of spent mana shrinks by a certain factor each turn.
Given such an index measure our search for an optimal mana curve is indeed a somewhat adventurous quest, even from a mathematical perspective. If you are interested in the potential pitfalls of finding the best curve, continue reading this section. Otherwise don’t hesitate to skip to the next section.
At first glance, the problem looks like a basic optimization problem. In school many of us have learned how to find the optimum of a function: Calculate some derivatives and find its roots, i.e. points where the derivative becomes zero. This approach unfortunately does not work for our index function, since the index takes a deck configuration as its argument instead of some real-valued variable \(x\).
Thus, we have to use an optimization algorithm that searches over the various possible deck configurations by trying different combinations of converted mana cost counts. Luckily, there is a plethora of various algorithms which do exactly that. The most simple versions start at a certain deck configuration, i.e. mana curve, compute the corresponding index and then iteratively exchange single cards in the deck, e.g. switch a two-drop for a three-drop or for a land, and check whether the index increased by the card exchange. By doing so, the algorithm steadily finds a better curve until it arrives at the optimal configuration at which no further improvement is possible.
Figure 2: Copyright owned by Wizards of the Coast
However, such an algrithm is still not sufficient for our purposes for the following reason: we don’t even really know the function to optimize. “Wait, what? Then what was all that previous post about?” you might ask. What I mean by that is, that we actually derived a random measure for evaluating a mana curve, since it samples some larger number of executed curves and calculates the average index based on this sample. If one would repeat this procedure one would actually obtain a different index result, that is of course rather close to the first one dependending on the size of the two respective samples. However, the exact true index result could only be obtained by sampling infinite deck configurations (or just try every possible of the \(40! = 40 \cdot 39 \cdot 38 \ldots\), which is also practically infinite) – this is not what we want to do.
In order to overcome this issue of uncertainty about the true index result of any mana curve we have to apply some statistics. Although due to the stochastic nature of the index measure, we can not be one-hundred-percent sure which one of two competing mana curves has a higher mean index, a statistical test might yield a more or less certain result when comparing the two respective index samples. The algorithm below does exactly that. Instead of computing the index measure of each mana curve for a preset sample size of executed curves, it increases the sample size if necessary in order to decide which of two mana curves yield a higher index.
Algorithm: Mana Curve Optimization
As in the previous post, let \(\mathbf{x}=(x_1, \ldots, x_n)\) be a decklist, where \(x_i\) denotes the number of cards with converted mana cost \(i\) up to \(n\) (\(n=8\) in our case), and let \(Y(\mathbf{x})\) be a random executed curve based on \(\mathbf{x}\). Thus \(Y(\mathbf{x})\) represents a random variable with components \((Y_1, Y_2, Y_3, \ldots)\) which refer to the amount of mana spent in each turn.
Let \(\mathcal{I}(y)\) be the index measure given the executed curve \(y\). Thus, \(\mathcal{I}(Y(\mathbf{x}))\) refers to the random variable representing the index measure of \(x\) based only on one sampled executed curve. In the following we will denote by \(I(\mathbf{x})\) one realization of this “one-sample” index of \(\mathbf{x}\).
The search algorithm to find for the optimal mana curve goes as follows. Let \(\mathbf{x}^{(0)}\) be some initial deck configuration and let \(I^{(k)}(\mathbf{x}^{(0)})\), (\(k = 1,\ldots, 100\)), be a sample of index evaluations for the deck configuration \(\mathbf{x}^{(0)}\).
For \(j = 1\) to some preset number of iterations \(N\) repeat the following steps 2) to 5).
Propose a new random candidate deck list \(\mathbf{x}^{*}\) by modifying the currently best deck list \(\mathbf{x}^{(j-1)}\) according to \[x^{*}_i = x^{(j-1)}_i + \Delta_i,\] where \(\Delta_i\) (\(i = 1, \ldots, n\)) is zero with probability \(1/2\) and one or minuns one with probability \(1/4\), respectively. Repeat this process, if the so proposed deck list is ill-defined, e.g. if it has more than 40 cards or any mana slot has less than zero cards.
Check if there are already some index evaluations \(I^{(k)}(\mathbf{x}^{*})\), (\(k = 1,\ldots, K\)), subject to the proposed deck list available (from previous suggestions of the exact same deck list). If not, generate and compute a sample of \(K = 100\) index evaluations \(I^{(k)}(\mathbf{x}^{*})\).
Perform a t-Test in order to check whether the index mean of the two samples \(\{I^{(k)}(\mathbf{x}^{*})\}\) and \(\{I^{(k)}(\mathbf{x}^{(j-1)})\}\) are different. Then, …
…if the test suggests the candidate deck list \(\mathbf{x}^{*}\) to yield higher index measures (at a significance level of \(\alpha = 0.001\)), set the so far optimal deck list \(\mathbf{x}^{(j)} = \mathbf{x}^{*}\).
…if the test suggests the previously optimal deck list \(\mathbf{x}^{(j-1)}\) to yield higher index measures, set the so far optimal deck list \(\mathbf{x}^{(j)} = \mathbf{x}^{(j-1)}\).
…if the test does not detect a statistically significant difference in the mean index measure, double the number of index samples for the deck with fewer index sample or, if the sample size was equal for both decks, double both samples. If both samples already exceed 100.000 index evaluations, do not sample any additional index evaluations and take the decklist which yields the higher mean index result (although not statistically significant) as the so far best deck list.
- Store the proposed deck list and all its sampled index evaluations for reusability within the algorithm.
The final result of this algorithm is a decklist \(\mathbf{x}^{(N)}\) which yields higher index results than all other along the way proposed deck configurations. Furthermore, the difference is actually statistically meaningful or otherwise based on a sufficiently large enough sample of index evaluations such that the actual mean index measure difference is marginal.
The optimal mana curve
I applied the above search algorithm to the Discount-Index for various discount factors from 0.55 to 0.8 as presented in the last post. As a reminder, higher discount factors put more weight on the later turns and thus the corresponding index assesses deck performance within slower games.
As a result from the search algorithm we do not only obtain the optimal mana curve for each index, but also a ranked list of mana curves together with their respective index results. Thus, we can assess the difference between the best and second best mana curve in terms of mean index result and the statistical significance of the difference to the best curve in terms of a p-value. The p-value provides the probability for observing the actually measured difference in the mean index results of two deck lists assuming that both deck’s indices have the same mean. If you read the previous sentence multiple times and still don’t have clue: A p-value somewhere below 0.05 is widely considered to be a signal for an actual difference between two decks, whereas p-values above 0.05 don’t really tell us much about the existence of a real difference. In other words: even after having goldfished each of two decks about one-hundred thousand times, \(p >0.05\) means we are still not sure whether there is actually a difference between two mana curves. Here are the results:
Erratum: I found and corrected a small bug in my code. Thus, the following results were updated on 2018/01/19. The overall take aways however remain the same.
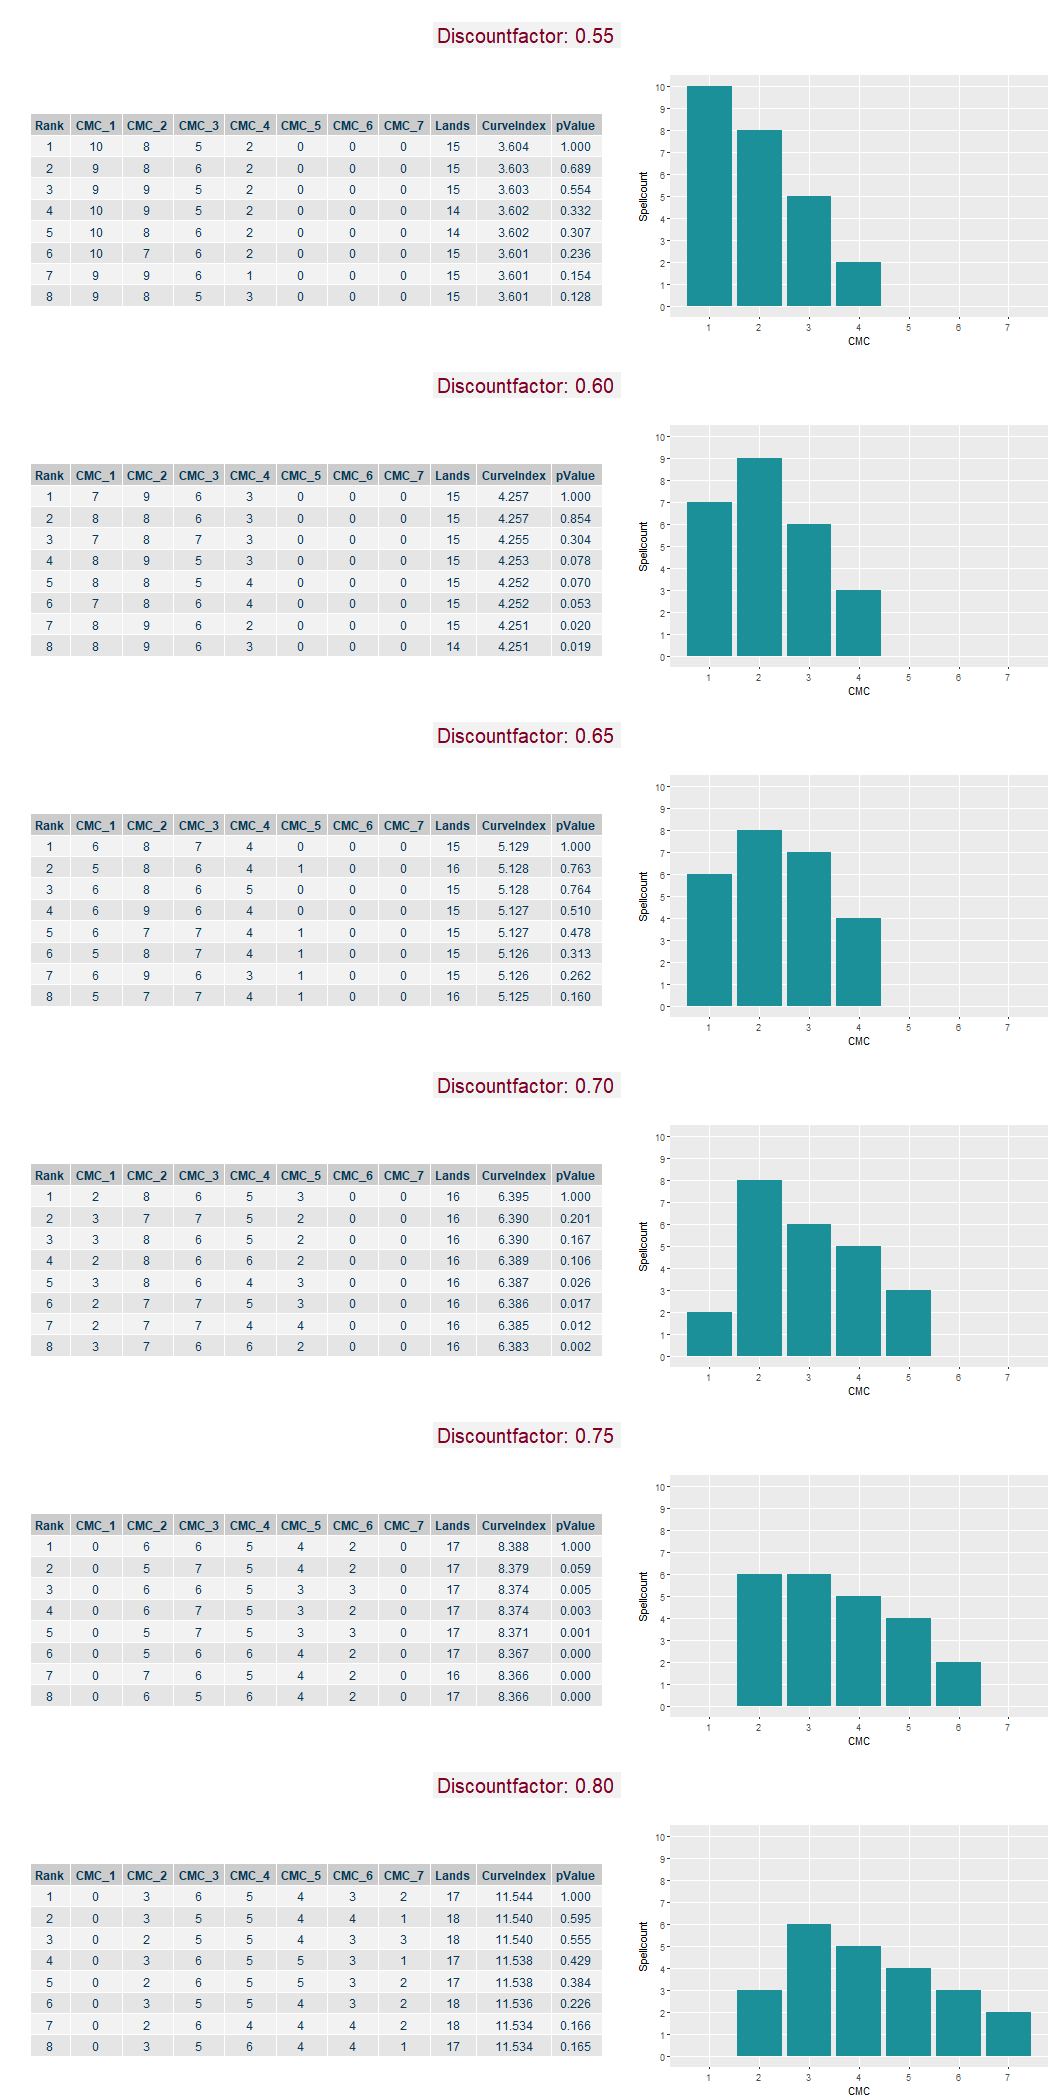
Figure 3: Results from mana curve optimization for different Discount-Indices. Left: Table with top 8 deck lists and respective mean index results. Right: Optimal mana curve per Index.
Let’s take a look. To me, there are three things to notice here:
For each different Discount-Index, the optimal mana curve has indeed a more or less bell-shapy curve. However, the higher the underlying discount factor, the more expensive are the mana costs around the peak of the curve and the overall average costs of the spells. This is somewhat clear as higher discount factors allow for slower games. This effect is even so pronounced, that for the fastest curve index (discount factor 0.55) four-drops are almost too expensive whereas according to the slower index (0.75 or higher) any one-drops or even two-drops become garbage.
The optimal land count ranges from 14 lands for cheap fast game mana curves up to 18 lands for the expensive curves within slow games. This is probably one or two lands fewer than most players would intuitively put into those decks considering the respective curve.
The optimal mana curve is not significantly better than the next best curve configurations as indicated by the tables shown along the optimal curves. The actual difference in the index results is neglible if only a few card slots are exchanged, e.g. for the 0.65 Discount-Index the mana curve of \((6, 8, 7, 4, 0)\) is effectively equal to a mana curve of \((5, 8, 6, 4, 1)\) which even plays an additional land. The difference is not even statistically significant after over 100.000 simulated curve executions as indicated by the p-value. Thus, the optimal curve does not represent a peak of a steep ascent but rather a top of a shallow hill, almost plateau-like.
Reminder Text
The here derived optimal mana curves should be taken with caution, as they are based on a few simplifying assumptions. First of all, we assumed that all spells have an immediate one-time board effect. We did not account for potential draw spells, mana ramp or mana sinks. Thus, the optimal curve of decks including such alternative effects might look different, e.g. the optimal mana curve of a deck with mana ramp certainly plays more expensive spells. However, some draft formats like Kaladesh or Amonkhet required aggressive strategies relying on board-affecting spells only. For such formats the here derived curves are very applicable.
Moreover, the index computation did not distinguish between different colors of mana, such that each spell could be cast with each land within the deck. Within an actual deck, color requirements put a higher demand on the mana base than in our simulation, such that the optimal deck configuration when also accounting for colors of mana might want to play more lands. This could be an explanation why the here shown mana curves play slightly fewer lands than one might expect.
Figure 4: Copyright owned by Wizards of the Coast
Given the presented optimal curves, it’s still not clear which of these curves should be aimed for in any given draft or sealed, since each underlying index relies on a different discount factor. As different limited environments promote different speeds, it’s certainly a question of experience which index suits a certain environment most. That being said, the optimal curves according to the two fastest index measures seem somewhat optimistic, since I don’t know any format which allows drafting such aggressive curves. However, when in doubt it’s better to maximise the index representing faster games, since a fast deck is better capable (compared to a slower deck) to dictate the pace of a game to its benefit.
Lastly, it’s worth to point out that there is not only one optimal mana curve, but rather a collection of curves which yield almost optimal index results. This means, that when making specific card choices during deck building it’s not necessary to exactly hit the best curve, but instead rather decide based on the individual power-level of the cards under consideration. The here presented curves should be seen more as a guide line for how a good curve should look like, e.g. “how many two-drops does a good deck roughly need in a fast environment?” or “how many five drops is a deck able to afford?”. Furthermore, if you go for an aggressive or defensive strategy, it’s also very important that your spells also match your game plan and not only your desired mana curve, e.g. it’s not very smart to play a two-mana 0/5 wall to improve the curve of your aggressive deck.
End of turn
I hope you liked this follow-up application to my introduction of evaluating mana curves. Again I would be very happy to hear your feedback on the results and whether these match your expectations. If you had to choose an index based on the optimal curve results, which one would you think provides the best representation for the ‘average’ limited format?
Next time I will take a closer look on the impact of non-board affecting spells. In which cases does a Divination actually improve your deck?