In my introductory post I said that I am a limited player by heart. To me Booster Draft is an art form. Drafting is relatively easy learn to a degree of being able to assemble functional decks. However, it is nearly impossible to become a complete master. Beyond the simple concept of “Take up the booster – Pick a card – Pass the remaining cards to the left.” , there are so many hidden dynamics to explore: Which colors are your neighbours drafting? Which colors are they not drafting? Are the packs weak or strong? What do your neighbors think which colors you are drafting? Do they even care? How does this affect your strategy?
Within this and the upcoming posts I will try to address some of these topics. Although forming a mathematical model around the concept of drafting and hidden draft dynamics seems ambitious, I personally believe it is possible. Essentially it’s a combination of knowing the frequency of cards and knowing what people like to pick from a given pack. Both of these aspects are more or less quantifiable through available data on the interweb. Still, within this post I will start with a rather low-level question:
What are the most frequent first picks within M19 booster draft?
Figure 1: Copyright owned by Wizards of the Coast
The solution to this problem is very likely not the insight that the mulitverse was waiting for. However, today’s post will be more about the tools than about the finished product as I will present a mathematical framework which we can later use to answer more in-depth questions. Nevertheless, what do you think is a more frequent first pick: Murder or Shock?
Resources
For the first time since creation of this blog we will be dealing with a specific Magic set. Thus, for the first time I was looking around for some ready-made set data which fortunately did not take very long. MTGJSON.COM is basically the first google hit and it has almost everything we need. This site provides card set data such as card names, mana costs, rules text, and even artists from every expansion of Magic’s past. Moreover it contains set specific meta data such as rarity distribution within booster packs which will also be useful for our purposes. Although this is all open information it’s very convenient to use this pre-built data instead of spending a few hours to make your own excel sheet. I highly recommend to check it out: MTGJSON.COM.
The second data source is even more crucial as we need some measure on how certain cards within a booster pack compete against each other, i.e. which cards are considered stronger and thus more likely to get picked out of a pack. The website DRAFTAHOLICSANONYMOUS.COM contains a very cool feature by the name P1P1 that captures this exact card competition.
In P1P1 every site visitor is asked which one of two randomly selected cards they would rather pick first from their first booster. The website records all these card choices and in doing so maintains an ELO based ranking of all cards within a set. This gives a very nice overview on which cards are considered stronger (and by how much) by the participating community.
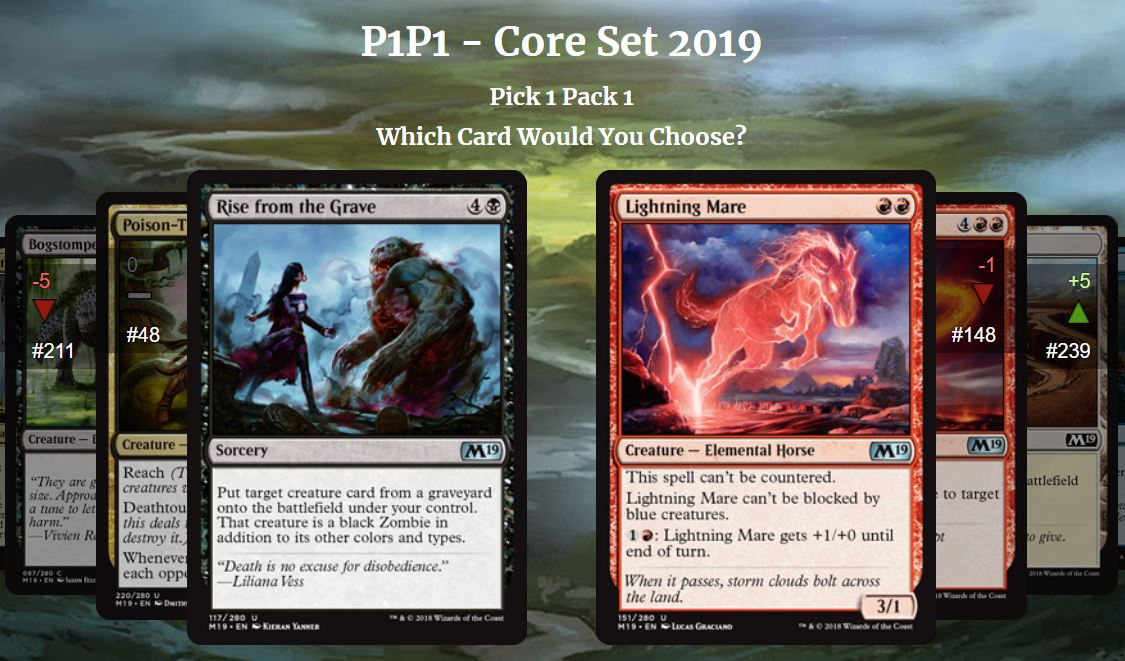
Figure 2: Screenshot of ‘draftaholicsanonymous.com’
A few things should be noted when using this data:
The derived ELO ranking of the cards is based upon the subjective opinion of all participating ‘voters’, i.e. it is not necessarily an accurate objective power ranking of the cards within the set (although it’s likely close to that). However, I think this is actually a nice feature of this data since we are primarily interested in what players actually pick from a booster instead of what the ‘objectively correct’ pick would be.
If we like to apply the card rating data to draw conclusions for, let’s say, the Magic Online booster draft environment, we need to assume that the community on DRAFTAHOLICS is roughly representative for the Magic Online player base. I’ll just do that here. Furthermore, I’ll assume that the voters on DRAFTAHOLICS aren’t goofing around and indeed pick according to their preferences – with one hand on the bible and another one on their heart (moving the mouse with their nose, I guess?).
Combining the expansion data with the ELO ranking from DRAFTAHOLICS yields a fully rated card set. The actual problem we are now confronted with is that P1P1 only asks you to choose between two cards and thus the resulting ELO ranking is only useful to make predictions on such two-card-matchups. In an actual draft however you must pick one from up to 15 cards within a single pack. Hence, we need to find a way to generalize the ELO model to a situation of more than just two competing cards. This will be the main methodological innovation of this post as covered in the next section.
From ELO to MELO
I already wrote about the ELO rating in one of my first blog posts, since ELO was once used by the DCI to rank Magic players whereas nowadays MTGELOPROJECT tries to recreate those ELO ratings. One purpose of the ELO ranking system is to maintain a rating system that is capable to predict the match outcome between any two rated players in terms of win probabilities for each player. In the context of P1P1, players are substituted by cards and the card ratings thus yield a probabilistic prediction for which one of any two cards the average player would pick. The mathematical framework is summarized below.
The ELO model
Given a competition between two players (or cards) A and B with ratings \(x_A\) and \(x_B\) the ELO system models the win probabilities \(p_A, p_B\) of player A and player B, respectively, as \[p_A = \frac{1}{1 + 10^{-(x_A - x_B) / c}} \quad \text{and} \quad p_B = \frac{1}{1 + 10^{-(x_B - x_A) / c}}.\] Here, \(c\) denotes the so-called ELO coefficient. Most systems including DRAFTAHOLICS use a value of \(c = 400\) such that a rating difference of 100 points yields a predicted win probability of 64 % for the higher rated player.
The win probabilities above might appear somewhat arbitrary, but they are in fact the solution of the following equation system.
\[\log \text{OR}(p_A, p_B) = 2 \bar{c} (x_A - x_B)\]
\[p_A + p_B = 1\]
Equation (1) provides the relationship between the probabilities \(p_A\) and \(p_B\) in terms of which win probability is higher and by how much. This is done via the odds ratio of those two probabilities, where the odds ratio is defined by \[\text{OR}(p_A, p_B) = \frac{p_A/ (1-p_A)}{p_B / (1-p_B)},\] i.e. as the ratio of the odds. An odds ratio larger than one implies that \(p_A\) is larger than \(p_B\) whereas an odds ratio smaller than one implies the opposite. On the log-scale this means that a positive rating difference \((x_A - x_B)\) implies that \(p_A\) is larger than \(p_B\) and vice versa. Here, larger rating differences also yield larger differences in the corresponding win probabilities \(p_A\) and \(p_B\). The coefficient \(\bar{c}\) controls the impact of the ratings difference and is given by \(c / \log(400)\) in order to adjust for the change to the natural logarithm (to the basis \(e\)).
Equation (2) is necessary for \((p_A, p_B)\) to be a proper propability distribution, i.e. there are only the two outcomes that either player A or B wins the match.
Solving this simple equation system leads to the known ELO win probabilities given above.
In order to apply the card ELO rating to a whole booster pack we need a generalization of the ELO system for ‘multiplayer’ competitions in which more than two players or cards compete against each other. The here newly introduced model (outlined below) does exactly that and therefor I will refer to it as the Multiplayer-ELO (MELO) model. Just like classic ELO, the MELO model only requires a rating for each competing player/card in order to predict corresponding win probabilities. For instance, when feeding the MELO model with 15 rated cards then for each of those cards the model will put out the corresponding probability that this card will be picked from a pack containing these exact 15 cards.
Similarly, the MELO model could be applied to predict the outcome of multiplayer games of chess or Magic, assuming that the ELO rated 1v1 skills of each player translate accordingly into a multiplayer setting. Furthermore, when fed with only two rated cards or players the MELO model yields the exact same win probabilities as the normal ELO model, which makes it a proper generalization in the mathematical sense.
The MELO (mulitplayer ELO) model
The idea behind the MELO model is generalize the ELO equation system as given above for the context of more than two competing players. Thus, for a set of \(N \geq 2\) players with ELO ratings \(x_1, \ldots, x_N\) the MELO model computes win probabilities \(p_1, \ldots, p_N \in [0,1]\) for each player by solving the following system of equations:
\[\log \text{OR}(p_i, p_j) = 2 \bar{c} (x_i - x_j) \qquad \text{for all} \quad i,j \in \{1,\ldots, N\}\]
\[\sum_{i=1}^N p_i = 1\]
Just like in the ELO model the second equation secures that the resulting win probabilities yield a proper probability distribution over all possible outcomes. The first equation determines the relation among the win probabilities again in terms of the odds ratio such that higher rated players will obtain higher win probabilities.
One mathematical issue is that Equation (1) yields in fact \(N^2\) equations for all possible combinations of \(i,j\) whereas the whole equation system includes only \(N\) parameters to compute, which usually leads to an overspecified equation system. Fortunately, due to formulating the MELO model in terms of odds ratios, many of these equation are consistent with each other, i.e. let’s say that the pairs \((p_1, p_2)\) and \((p_2, p_3)\) each fulfill Equation (1), then
\[ \begin{aligned} \log \text{OR}(p_1, p_3) &= \log \left( \text{OR}(p_1, p_2) \text{OR}(p_1, p_2) \right) \\ &= \log \text{OR}(p_1, p_2) + \log\text{OR}(p_2, p_3) \\ &= 2 \bar{c} (x_1 - x_2) + 2 \bar{c} (x_2 - x_3) \\ &= 2 \bar{c} (x_1 - x_3) \end{aligned} \]
Thus, also the pair \((p_1, p_3)\) automatically fulfills Equation (1). Therefor, all the conditions captured by Equation (1) actually yield only \(N-1\) distinct pieces of information. Together with Equation (2) this makes \(N\) effectively different conditions for our \(N\) free parameters. Sounds convenient.
The second problem is to actually solve the equation system. Since logarithmic equations are difficult to handle analytically, the overall system must be solved numerically. To do so, just take any starting value for \(p_1 \in (0,1)\), compute all other probabilities \(p_2, \ldots, p_N\) subject to Equation (1) using the given ratings \(x_1, \ldots, x_N\). Afterwards check whether the sum \(\sum_{i=1}^N p_i\) yields \(1\) in order to fulfill Equation (2). If not, adjust the value of \(p_1\) accordingly and iterate this process until \(\sum_{i=1}^N p_i\) is sufficiently close to \(1\). (My implementation of this within R can be found here)
The final output of this model is the vector containing each player’s match win probability given a mulitplayer game among these \(N\) players. In the context of booster draft, the resulting vector can be interpreted as each card’s probability to be picked from a pack containing those \(N\) cards based on the DRAFTAHOLICS card ratings.
Crack a Pack
To provide an example I sampled a random M19 booster pack, assigned the corresponding card ratings and computed each card’s pick probability according to the MELO model. Let’s take a look at the booster:
| Name | Rarity | Rating | P1P1 |
|---|---|---|---|
| Trusty Packbeast | Common | 1418 | 0.2 % |
| Gearsmith Prodigy | Common | 1242 | 0.0 % |
| Bogstomper | Common | 1310 | 0.0 % |
| Child of Night | Common | 1439 | 0.2 % |
| Sovereign’s Bite | Common | 1149 | 0.0 % |
| Strangling Spores | Common | 1819 | 14.9 % |
| Boggart Brute | Common | 1658 | 2.7 % |
| Havoc Devils | Common | 1562 | 0.9 % |
| Rabid Bite | Common | 1802 | 12.6 % |
| Talons of Wildwood | Common | 1457 | 0.3 % |
| Supreme Phantom | Rare | 1607 | 1.5 % |
| Herald of Faith | Uncommon | 1990 | 55.6 % |
| Skilled Animator | Uncommon | 1744 | 6.9 % |
| Siegebreaker Giant | Uncommon | 1702 | 4.3 % |
This table shows the the rating and resulting probability to get picked (P1P1) for each card contained in this randomly sampled booster pack.
The highest rated card within the booster is Herald of Faith with a corresponding pick probability of 55.6 %. Maybe the best interpretation of this probability is that “55.6 % of all players would pick Herald of Faith from this booster”. Within this pack there are also three other cards with a considerable probability to be first picks: Strangling Spores, Rapid Bite, and maybe Skilled Animator.
Note, that according to the MELO model each card has a non-zero probability to get picked, although the predicted probabilities are close to zero for most cards.
Pick One Pack One
Coming back to our original question, we now want to apply the MELO model in order to compute the most frequent first picks in any given format. As already said, the probability that a specific card will be first picked by some generic player is a combination of its rarity, i.e. the likelihood of its appearance in the pack, and its relative powerlevel, which determines the likelihood of the card being actually picked from the pack.
Using some Monte Carlo sampling we can estimate these first pick probabilities (FPP) by generating a lot of random booster packs, where for each pack we compute each card’s FPP using the MELO model. For details see the algorithm below.
FPP Algorithm
Let \(C_1, \ldots, C_M\) denote the cards from a Magic set with overall \(M\) cards. Let \(r_i\, (i = 1,\ldots,M)\) be the rarity of card \(C_i\) taking values in \(\{m,r,u,c\}\) (mythic, rare, uncommon, common). Let \(x_i\, (i = 1,\ldots,M)\) be the DRAFTAHOLICS rating of card \(C_i\). Let \(N_B\) be a prespecified number of booster packs:
- For \(k\) from 1 to \(N_B\) repeat steps a) to c):
Generate a random pack: Based on the rarity distribution for a booster pack of the given Magic expansion sample \(n_r\) rares/mythics, \(n_u\) uncommons, and \(n_c\) commons from among \(C_1, \ldots, C_M\). This leads to a random pack containing \(n\) distinct cards \(C_{i_1}, \ldots, C_{i_n}\), where \(n\) is typically 14 for current expansions.
Compute the pick probabilities: By applying the MELO model to the ratings \(x_{i_1}, \ldots, x_{i_n}\) of the cards contained in the pack, compute the probabilities \(P_{i_1}, \ldots, P_{i_n}\) for each card to be picked from that pack.
Store pick probabilities: For each card \(C_{i_j}\) that is contained in pack \(k\) we store the pick probability \(p^{(k)}_{i_j} = P_{i_j}\) and for each card that was not contained in the pack (\(i \neq i_1, \ldots, i_n\)) we set \(p^{(k)}_i = 0\), i.e. those cards had zero chance to be picked from the pack.
- The FPP \(p_i\) of each card \(C_i\) is then estimated by computing the average pick probability over all simulated booster packs, i.e. for all \(i = 1,\ldots,M\) we compute \[p_i = \frac{1}{N_B} \sum_{k=1}^{N_B} p_i^{(k)}.\]
First picks in M19
I applied the above FPP algorithm to the M19 expansion and simulated overall 500000 booster packs. The table below shows the top 20 cards according to their FPP in descending order. The underlying DRAFTAHOLICS ratings were accessed on 2018-08-11. For the full data table containing the whole set look here.
| Name | Rarity | Rating | FPP (in %) |
|---|---|---|---|
| Lich’s Caress | Common | 2056 | 4.39 |
| Electrify | Common | 1984 | 3.42 |
| Luminous Bonds | Common | 1979 | 3.33 |
| Angel of the Dawn | Common | 1937 | 2.78 |
| Murder | Uncommon | 2161 | 2.45 |
| Hieromancer’s Cage | Uncommon | 2144 | 2.37 |
| Star-Crowned Stag | Common | 1888 | 2.12 |
| Pegasus Courser | Common | 1874 | 1.96 |
| Shock | Common | 1852 | 1.73 |
| Vine Mare | Uncommon | 2019 | 1.66 |
| Dryad Greenseeker | Uncommon | 2012 | 1.62 |
| Lightning Strike | Uncommon | 2000 | 1.55 |
| Herald of Faith | Uncommon | 1990 | 1.49 |
| Demanding Dragon | Rare | 2305 | 1.40 |
| Strangling Spores | Common | 1819 | 1.39 |
| Vampire Sovereign | Uncommon | 1968 | 1.38 |
| Lathliss, Dragon Queen | Rare | 2254 | 1.35 |
| Take Vengeance | Common | 1814 | 1.33 |
| Rabid Bite | Common | 1802 | 1.24 |
| Banefire | Rare | 2182 | 1.22 |
As we can see, the most frequently first picked cards are not the bomb rares of the set, but rather the common removal spells, headed by Lich’s Caress, Electrify and Luminous Bond. Roughly 1 out of 9 drafts is started by picking one of these three cards. In comparison, the overall highest rated rare Demanding Dragon gets first picked in only 1.4 % of all drafts (which roughly corresponds to the likelihood of being opened first pack).
Another interesting perspecive is a look at the colors that are most likely to be first picked. For that, I just aggregated the FPPs of all cards from any one color and did the same for multicolored and colorless cards. The table below provides these numbers.
| Color | FPP |
|---|---|
| White | 25.0 % |
| Black | 17.6 % |
| Red | 17.2 % |
| Green | 15.1 % |
| Blue | 13.3 % |
| Mulitcolor | 8.1 % |
| Colorless | 3.7 % |
Apparently,White is the most frequently first picked color and that even by a considerable margin. Blue is the color, that is least likely to get first picked by the average player.
Reminder Text
Knowing the first pick distribution of a set as well as other possible applications of the MELO model might yield valuable insight into a draft format. However, there is one important caveat to consider: These results are more or less theoretical predictions based on some card ratings and a mathematical model, but are lacking any empirical evidence. This means…
our predictions carry over any biases from the DRAFTAHOLICS ranking. If a certain card was overrated on DRAFTAHOLICS it would also receive an overestimated FPP in our results.
the MELO model itself relies on some (yet plausible) assumptions on how the ELO ranking translates into a multiplayer setting. For instance a similar model could be derived by formulating equations based on probability ratios instead of odds ratios.
it is not clear wether our predictions actually match the first pick frequencies on, e.g., Magic Online. Unfortunately, such data for the purpose of validation is not easily available.
End of Turn
Within this post we introduced the concept of the MELO model as a generalization of the well known ELO model for multiplayer settings. Combined with Magic card ratings from DRAFTAHOLICS the MELO model is a powerful tool to make predictions regarding which card gets picked from a specific booster pack.
Figure 3: Copyright owned by Wizards of the Coast
Here we applied the model to the question “What are the most frequent first picks in M19?” and received somewhat interesting results. Although these are not game-changing insights, it still shows that the MELO model is capable to put a number on some aspects of booster draft, which were so far driven by gut feeling only.
Within the next post(s?) I will try to further utilize the MELO model by taking the next steps beyond the first pick of a draft. Can we derive a measure to evaluate the “signality” of a card within a later pack?
Until then I am always interested in your thoughts. Is the here derived FPP-distribution in line with your experiences? What do you think of the concept of the MELO model and the underlying DRAFTAHOLICS data? I’d be glad to hear from you.